

Academic Program Assessment Data Visualizations
Assessment is the cornerstone of the continuous improvement process at any university or college and is a systematic process of gathering, reviewing, and using data to make improvements. For academic programs at Virginia Tech, this process includes assessing both the student learning and program outcomes in every degree-granting program. Academic program assessment helps a program identify its strengths and areas for improvement; provides student learning evidence for stakeholders including discipline-specific and regional accreditors; highlights program contributions to stakeholders; encourages collaboration among program faculty; creates a program vision and ideal; and encourages curriculum review. The main purpose of academic program assessment is to improve the teaching and learning process.
All academic programs are required to submit annual assessment reports by degree level (i.e., associate’s, bachelor’s, master’s, doctoral, and professional degree programs). Each year, academic degree programs assess at least two student learning outcomes and one program outcome. Degree programs present the outcome, the measure used to assess the outcome, and the target for that outcome-measure pair as well as provide findings from the assessment and comment on what the findings represent. In addition, degree programs are required to have an action plan for any unmet outcomes and, if all targets are met, provide at least one action plan. Degree programs are also required to comment on any previously implemented action plans for outcomes evaluated, including any results of changes that were made.
Data Visualizations
The following data visualizations are based on the annual academic program assessment reports submitted by degree programs for the 2018-19 assessment cycle. In order to develop these visualizations, Institutional Effectiveness professionals from the Office of Analytics and Institutional Effectiveness examined each submitted report and coded all required areas.
The interactive visualizations present all of the data submitted for student learning and program outcomes for the 2018-19 assessment cycle. Some static visualizations of this process are provided below. The interactive visualizations have been created for individuals who are interested in further exploring this data.
Student Learning Outcome Visualizations
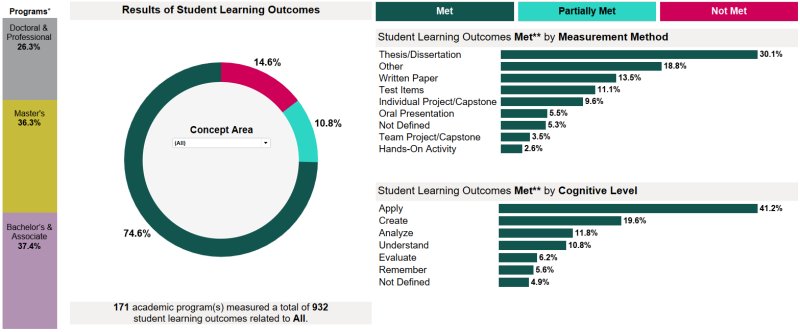
Student learning outcomes specify the key knowledge, skills, abilities, or competencies that students in a particular degree program should know, have, or be able to do upon completing the program. The pie chart in the visualization below shows the results for the student learning outcomes in all concept areas measured by programs during the 2018-19 academic year. As indicated below the pie chart, 171 academic programs measured a total of 932 student learning outcomes related to all concept areas. Targets were met for 74.6 percent of student learning outcomes in all concept areas. Note that the determination of outcomes being met, partially met, or not met is not an indicator of program quality. Programs select different targets and evaluate student work differently. This judgement is based on the target established by the program and its determination of the extent to which the target was met. Academic program assessment seeks to collect data that can inform program decision-making and improvement.
The top bar graph on the right shows the measurement methods used by various programs when targets were met. For instance, 13.5 percent of student learning outcomes met for all concept areas used Written Papers as the measurement method, while 2.6 percent used a Hands-On Activity as the measurement method.
The second bar graph shows student learning outcomes met by cognitive level. Each of the student learning outcomes was classified into a specific cognitive level category established in Bloom’s Taxonomy. Bloom’s Taxonomy is a framework often used in teaching and learning to classify learning objectives based on their level of complexity. The example presented below shows that 41.2 percent of the student learning outcomes that were met across all concept areas were at the Apply level of Bloom’s Taxonomy.
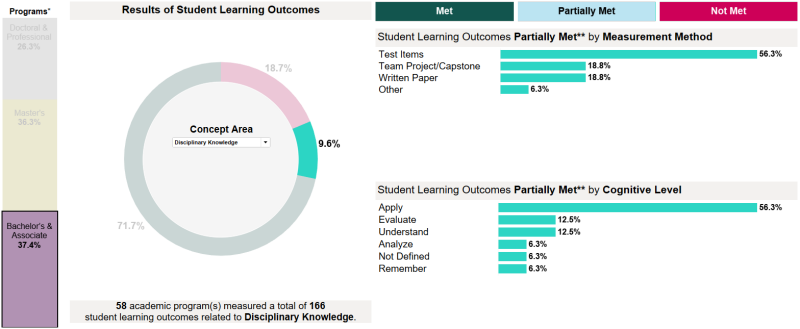
In our interactive visualizations, you will be able to explore the various concepts areas measured by Virginia Tech’s programs by degree level and outcome status (met, partially met, and not met). For example, as seen below, 58 Bachelor’s and Associate academic programs measured 166 student learning outcomes related to Disciplinary Knowledge. Targets were partially met for 9.6 percent of the student learning outcomes related to Disciplinary Knowledge.
Academic Program Outcomes
Academic program outcomes reflect the services a program provides or delineate programmatic student achievement areas (e.g., retention and graduation rates). Program outcomes reflect areas in which a program both wants to and can improve. They are distinct from program requirements that all students must meet in order to graduate.
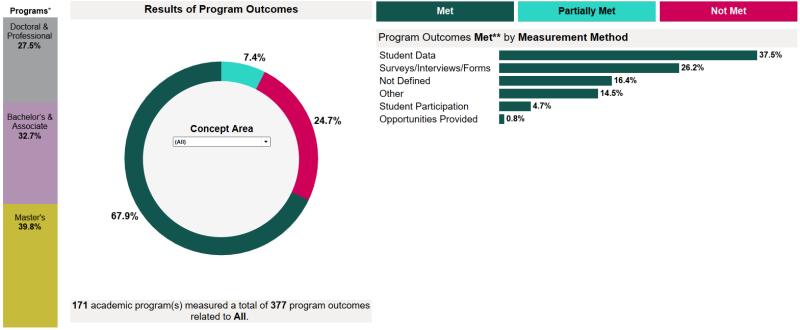
The visualization below shows the results of the academic program outcomes measured for all concept areas during the 2018-19 academic year. As indicated below the pie chart, 171 academic programs measured a total of 377 program outcomes; targets were met for 67.9 percent of program outcomes in all concept areas.
As explained in the student learning outcomes section above, the top bar graph on the right shows the measurement methods used by the various programs when the target was met. For example, 37.5 percent of the program outcomes that were met were measured using Student Data.
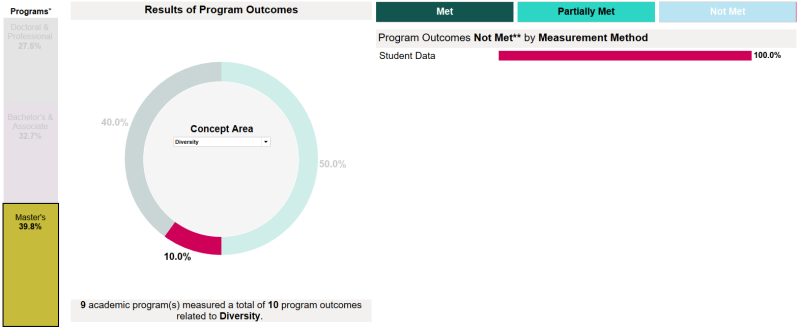
To explore the various program outcome concept areas you can utilize our interactive visualizations. For instance, as shown below, 9 Master’s degree programs measured a total of 10 program outcomes related to Diversity. Targets were not met for 10 percent of program outcomes.
*The number of academic programs indicated represents the number of programs that submitted assessment reports for the 2018-19 academic year, not all programs within a particular college or at Virginia Tech. While post-baccalaureate certificate programs also engage in the annual assessment process, the results for these programs are currently not included in the data visualization.
**The determination of outcomes being met, partially met, or not met is not an indicator of program quality. Programs select different targets and evaluate student work differently. This judgement is based on the target established by the program and its determination of the extent to which the target was met. Academic program assessment seeks to collect data that can inform program decision-making and improvement.
Please visit our interactive visualizations to explore additional information related to student learning outcomes and program outcomes.