

Data Visualizations
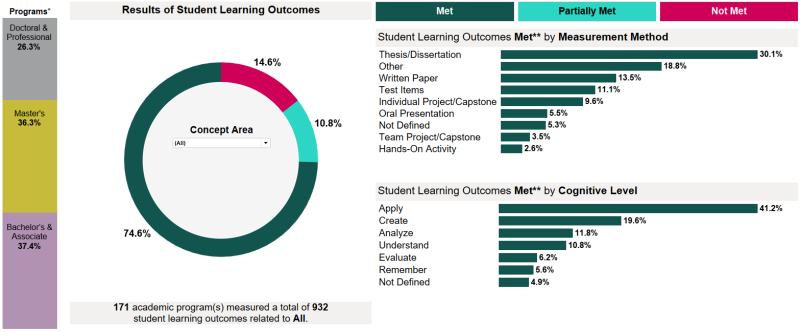
Assessment is the cornerstone of the continuous improvement process at any university or college and is a systematic process of gathering, reviewing, and using data to make improvements. For academic programs at Virginia Tech, this process includes assessing both the student learning and program outcomes in every degree-granting program. The data visualizations are based on the annual academic program assessment reports submitted by degree programs. Please visit our interactive Academic Program Assessment Data visualizations to explore additional information related to student learning outcomes and program outcomes.
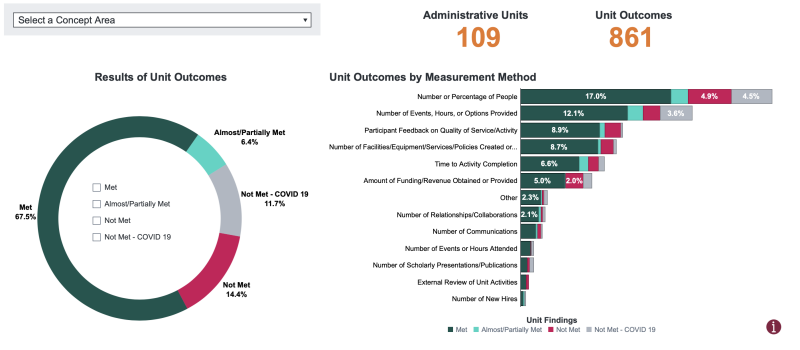
Administrative unit data are used to identify improvement areas and enhance the services and products administrative units provide to the university. Please visit our interactive Administrative Unit Assessment Data visualizations to explore additional information related to administrative unit and student learning outcomes.
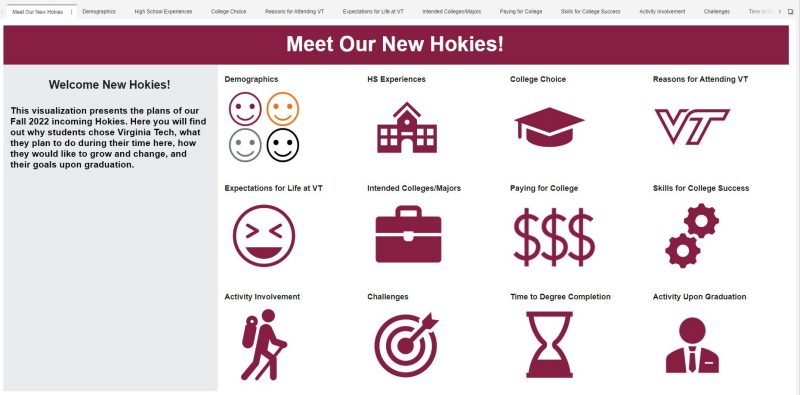
Virginia Tech's Survey of Incoming First-Year students is a locally-developed survey that replaces the nationally administered CIRP survey used by the university for many years. The instrument asks for students' perceptions of their high school experiences and their beliefs about what they will experience at VT. Institutional Effectiveness developed an interactive visualization that highlights important insights about the incoming first-year class.
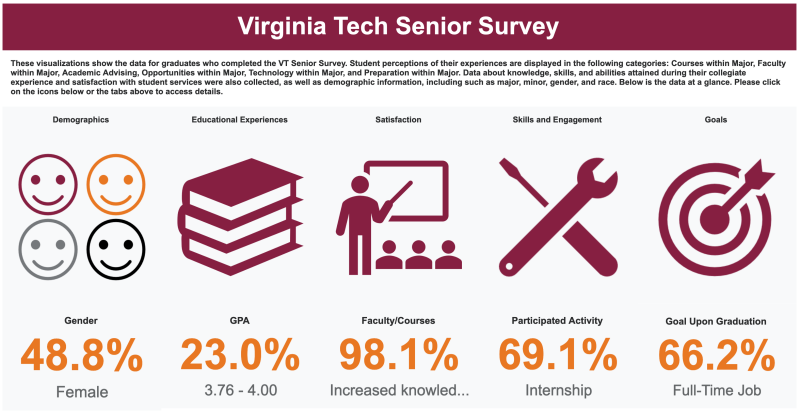
This locally-developed survey is administered annually to all graduating seniors. Student perceptions data are collected in the following categories: Courses within major, Faculty within major, Academic Advising, Opportunities within major, Technology within major, and Preparation within major. Data about knowledge, skills, and abilities provided by the university and satisfaction with student services is also collected, as well as demographic information, including major, gender, and ethnicity. These interactive visualizations highlight important insights about Virginia Tech’s recent graduates.